
List of municipalities in Albacete


Albacete is a province in the autonomous community of Castilla–La Mancha, Spain that is divided into 87 municipalities. According to the 2023 Spanish Census, the province is the 35th largest by population with 387,529 inhabitants[1] but is the ninth largest by land area spanning 14,922.19 square kilometres (5,761.49 sq mi).[2] Municipalities enjoy a large degree of autonomy in their local affairs. Amongst other tasks, they are in charge of urban planning, water supply, lighting, road network, local police and fire fighting.[3]
Municipalities are the basic local political division in Spain,[4] and can only belong to one province.[5] The organisation of the municipalities is outlined in a law passed on 2 April 1985,[6] completed by an 18 April 1986 royal decree.[7] The Statute of Autonomy of Castilla–La Mancha also contains provisions concerning the relations between the municipalities and the autonomous government of Castilla–La Mancha.[8] All citizens of Spain are required to register in the municipality in which they reside.[9] Each municipality is a corporation with independent legal personhood: its governing body is called the ayuntamiento (municipal council or corporation),[10] a term often also used to refer to the municipal offices (city and town halls). The ayuntamiento is composed of the mayor (Spanish: alcalde), the deputy mayors (tenientes de alcalde) and the plenary assembly (pleno) of councillors (concejales).[11] Municipalities are categorized by population for the purpose of determining the number of concejales: three when the population is up to 100 inhabitants, five for 101–250, seven for 251–1,000, nine for 1,001–2,000, eleven for 2,001–5,000, thirteen for 5,001–10,000, seventeen for 10,001–20,000, twenty-one for 20,001–50,000 and twenty-five for 50,001–100,000.[12] A further concejal is added for every additional 100,000 inhabitants, although the figure can never be an odd one.[12]
The mayor and the deputy mayors are elected by the plenary assembly, which is itself elected by universal suffrage on a list system every four years.[12] The plenary assembly must meet periodically at the seat of the ayuntamiento, more or less often depending on the population of the municipality: monthly for those whose population is larger than 20,000, once every two months if it ranges between 5,001 and 20,000, and once every three months if it does not exceed 5,000.[13] Many ayuntamientos also have a junta de gobierno local, named by the mayor from amongst the councillors—it is required for municipalities of more than 5,000 inhabitants.[11] The junta de gobierno local, whose role is to assist the mayor between meetings of the plenary assembly, may not include more than one third of the councillors.[14]
The largest municipality by population in the province of Albacete as of the 2023 Spanish census is Albacete, its capital, with 173,202 residents, while the smallest is Villa de Ves with 61 residents.[15] The largest municipality by area is also Albacete, which spans 1,126.98 km², while Cotillas is the smallest at 14.46 km².[2]
Municipalities[edit]
- Largest municipalities in the province of Albacete by population
-
 Albacete is the province's capital and largest municipality by population
 -
 Hellin, the second largest municipality by population in the province of Albacete
 -
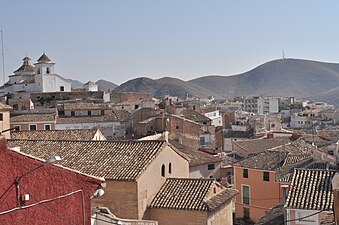
 Villarrobledo is the province of Albacete's third largest municipality by population
 -
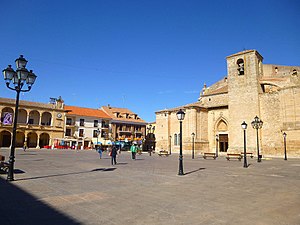
 Almansa, the province of Albacete's fourth largest municipality by population

.jpg)


| Name | Population (2023 census)[15] |
Population (2011 census)[16] |
Change | Land area (km²)[2] | Population density (2023) |
|---|---|---|---|---|---|
| Abengibre | 768 | 859 | −10.6% | 30.76 | 25.0/km2 |
| Alatoz | 503 | 587 | −14.3% | 63.85 | 7.9/km2 |
| Albacete† | 173,202 | 171,999 | +0.7% | 1,126.98 | 153.7/km2 |
| Albatana | 660 | 784 | −15.8% | 30.52 | 21.6/km2 |
| Alborea | 680 | 830 | −18.1% | 71.86 | 9.5/km2 |
| Alcadozo | 649 | 732 | −11.3% | 99.58 | 6.5/km2 |
| Alcalá del Júcar | 1,114 | 1,335 | −16.6% | 146.82 | 7.6/km2 |
| Alcaraz | 1,305 | 1,585 | −17.7% | 370.33 | 3.5/km2 |
| Almansa | 24,246 | 25,316 | −4.2% | 532.40 | 45.5/km2 |
| Alpera | 2,288 | 2,410 | −5.1% | 178.37 | 12.8/km2 |
| Aýna | 611 | 788 | −22.5% | 146.58 | 4.2/km2 |
| Balazote | 2,412 | 2,410 | +0.1% | 65.15 | 37.0/km2 |
| El Ballestero | 414 | 459 | −9.8% | 138.69 | 3.0/km2 |
| Balsa de Ves | 136 | 182 | −25.3% | 75.89 | 1.8/km2 |
| Barrax | 1,877 | 2,010 | −6.6% | 189.77 | 9.9/km2 |
| Bienservida | 568 | 703 | −19.2% | 91.43 | 6.2/km2 |
| Bogarra | 746 | 1,007 | −25.9% | 166.01 | 4.5/km2 |
| Bonete | 980 | 1,226 | −20.1% | 125.53 | 7.8/km2 |
| El Bonillo | 2,646 | 3,010 | −12.1% | 502.86 | 5.3/km2 |
| Carcelén | 490 | 633 | −22.6% | 75.36 | 6.5/km2 |
| Casas de Juan Núñez | 1,350 | 1,433 | −5.8% | 88.98 | 15.2/km2 |
| Casas de Lázaro | 326 | 453 | −28.0% | 112.31 | 2.9/km2 |
| Casas de Ves | 561 | 711 | −21.1% | 125.40 | 4.5/km2 |
| Casas-Ibáñez | 4,575 | 4,805 | −4.8% | 103.25 | 44.3/km2 |
| Caudete | 10,171 | 10,460 | −2.8% | 141.23 | 72.0/km2 |
| Cenizate | 1,163 | 1,243 | −6.4% | 63.26 | 18.4/km2 |
| Chinchilla de Monte-Aragón | 4,606 | 4,081 | +12.9% | 679.27 | 6.8/km2 |
| Corral-Rubio | 302 | 403 | −25.1% | 94.75 | 3.2/km2 |
| Cotillas | 130 | 157 | −17.2% | 14.46 | 9.0/km2 |
| Elche de la Sierra | 3,570 | 3,937 | −9.3% | 239.49 | 14.9/km2 |
| Férez | 619 | 737 | −16.0% | 126.15 | 4.9/km2 |
| Fuensanta | 297 | 369 | −19.5% | 24.11 | 12.3/km2 |
| Fuente-Álamo | 2,438 | 2,657 | −8.2% | 133.37 | 18.3/km2 |
| Fuentealbilla | 1,828 | 1,981 | −7.7% | 108.29 | 16.9/km2 |
| La Gineta | 2,601 | 2,576 | +1.0% | 137.13 | 19.0/km2 |
| Golosalvo | 92 | 119 | −22.7% | 28.17 | 3.3/km2 |
| Hellín | 30,499 | 31,202 | −2.3% | 779.29 | 39.1/km2 |
| La Herrera | 314 | 350 | −10.3% | 63.42 | 5.0/km2 |
| Higueruela | 1,150 | 1,296 | −11.3% | 205.45 | 5.6/km2 |
| Hoya-Gonzalo | 624 | 745 | −16.2% | 114.57 | 5.4/km2 |
| Jorquera | 345 | 425 | −18.8% | 67.94 | 5.1/km2 |
| Letur | 928 | 1,073 | −13.5% | 264.40 | 3.5/km2 |
| Lezuza | 1,302 | 1,585 | −17.9% | 360.61 | 3.6/km2 |
| Liétor | 1,077 | 1,406 | −23.4% | 313.18 | 3.4/km2 |
| Madrigueras | 4,680 | 4,847 | −3.4% | 73.34 | 63.8/km2 |
| Mahora | 1,496 | 1,432 | +4.5% | 108.14 | 13.8/km2 |
| Masegoso | 139 | 117 | +18.8% | 103.87 | 1.3/km2 |
| Minaya | 1,455 | 1,679 | −13.3% | 69.98 | 20.8/km2 |
| Molinicos | 829 | 1,012 | −18.1% | 143.58 | 5.8/km2 |
| Montalvos | 89 | 127 | −29.9% | 24.66 | 3.6/km2 |
| Montealegre del Castillo | 2,041 | 2,240 | −8.9% | 177.41 | 11.5/km2 |
| Motilleja | 665 | 588 | +13.1% | 23.82 | 27.9/km2 |
| Munera | 3,409 | 3,753 | −9.2% | 230.53 | 14.8/km2 |
| Navas de Jorquera | 516 | 550 | −6.2% | 42.25 | 12.2/km2 |
| Nerpio | 1,175 | 1,476 | −20.4% | 436.74 | 2.7/km2 |
| Ontur | 1,917 | 2,239 | −14.4% | 54.40 | 35.2/km2 |
| Ossa de Montiel | 2,213 | 2,633 | −16.0% | 243.70 | 9.1/km2 |
| Paterna del Madera | 353 | 440 | −19.8% | 112.33 | 3.1/km2 |
| Peñas de San Pedro | 1,458 | 1,354 | +7.7% | 158.76 | 9.2/km2 |
| Peñascosa | 331 | 391 | −15.3% | 189.25 | 1.7/km2 |
| Pétrola | 670 | 820 | −18.3% | 74.60 | 9.0/km2 |
| Povedilla | 396 | 536 | −26.1% | 49.42 | 8.0/km2 |
| Pozo Cañada | 2,713 | 2,865 | −5.3% | 116.83 | 23.2/km2 |
| Pozohondo | 1,553 | 1,788 | −13.1% | 136.42 | 11.4/km2 |
| Pozo-Lorente | 390 | 449 | −13.1% | 80.98 | 4.8/km2 |
| Pozuelo | 469 | 573 | −18.2% | 133.97 | 3.5/km2 |
| La Recueja | 221 | 310 | −28.7% | 29.37 | 7.5/km2 |
| Riópar | 1,323 | 1,466 | −9.8% | 81.00 | 16.3/km2 |
| Robledo | 396 | 459 | −13.7% | 120.08 | 3.3/km2 |
| La Roda | 15,632 | 16,325 | −4.2% | 397.88 | 39.3/km2 |
| Salobre | 435 | 585 | −25.6% | 49.52 | 8.8/km2 |
| San Pedro | 1,187 | 1,297 | −8.5% | 83.11 | 14.3/km2 |
| Socovos | 1,704 | 1,952 | −12.7% | 139.12 | 12.2/km2 |
| Tarazona de la Mancha | 6,156 | 6,678 | −7.8% | 212.67 | 28.9/km2 |
| Tobarra | 7,819 | 8,195 | −4.6% | 325.21 | 24.0/km2 |
| Valdeganga | 1,968 | 1,981 | −0.7% | 70.65 | 27.9/km2 |
| Vianos | 322 | 405 | −20.5% | 128.05 | 2.5/km2 |
| Villa de Ves | 61 | 54 | +13.0% | 57.75 | 1.1/km2 |
| Villalgordo del Júcar | 1,110 | 1,230 | −9.8% | 46.68 | 23.8/km2 |
| Villamalea | 3,953 | 4,110 | −3.8% | 128.32 | 30.8/km2 |
| Villapalacios | 556 | 685 | −18.8% | 87.47 | 6.4/km2 |
| Villarrobledo | 25,090 | 26,526 | −5.4% | 862.39 | 29.1/km2 |
| Villatoya | 114 | 131 | −13.0% | 18.67 | 6.1/km2 |
| Villavaliente | 209 | 271 | −22.9% | 34.84 | 6.0/km2 |
| Villaverde de Guadalimar | 311 | 405 | −23.2% | 69.28 | 4.5/km2 |
| Viveros | 308 | 358 | −14.0% | 65.36 | 4.7/km2 |
| Yeste | 2,504 | 3,183 | −21.3% | 509.38 | 4.9/km2 |
| Province of Albacete | 387,529[17] | 401,580[18] | −3.5% | 14,922.19 | 26.0/km2 |
| Castilla–La Mancha | 2,084,086[17] | 2,106,331[18] | −1.1% | 79,406.40 | 26.2/km2 |
| Spain | 48,085,361[17] | 46,815,916[18] | +2.7% | 504,729.70 | 95.3/km2 |
See also[edit]
References[edit]
- ^ "Censo anual de población 2021-2023. Cifras de población. Principales resultados. 2021-2023. Población según comunidad autónoma y provincia y sexo" (in Spanish). National Statistics Institute. Retrieved 27 May 2024.
- ^ a b c "Nomenclátor Geográfico de Municipios y Entidades de Población" (in Spanish). Centro Nacional de Información Geográfica. Retrieved 12 July 2024.
- ^ BOE 1985, pp. 22–23.
- ^ BOE 1985, p. 11.
- ^ BOE 1985, p. 14.
- ^ BOE 1985.
- ^ BOE 1986.
- ^ BOE 1982.
- ^ BOE 1985, p. 15.
- ^ BOE 1985, pp. 13–14.
- ^ a b BOE 1985, p. 19.
- ^ a b c "Ley Orgánica 5/1985, de 19 de junio, del Régimen Electoral General" (PDF) (in Spanish). Junta Electoral Central. 1985. Retrieved 11 July 2024.
- ^ BOE 1985, p. 33.
- ^ BOE 1985, p. 21.
- ^ a b "Censo anual de población 2021-2023. Resultados por municipios. 2021-2023. Población por sexo, edad (grupos quinquenales) y nacionalidad (española/extranjera)" (in Spanish). National Statistics Institute. Retrieved 27 May 2024.
- ^ "Censos de Población y Viviendas 2011. Resultados Municipales - Albacete. Población por municipios, sexo y edad (año a año)" (in Spanish). National Statistics Institute. Retrieved 23 May 2024.
- ^ a b c "Censo anual de población 2021-2023. Resultados nacionales, por comunidades autónomas y provincias. 2021-2023. Población por sexo, edad (año a año) y nacionalidad (española/extranjera)" (in Spanish). National Statistics Institute. Retrieved 27 May 2024.
- ^ a b c "Censos de Población y Viviendas 2011. Resultados Nacionales, por Comunidades Autónomas y Provincias. Población según comunidad autónoma y provincia y sexo" (in Spanish). National Statistics Institute. Retrieved 27 May 2024.
Works cited[edit]
- BOE (1982). "Ley Orgánica 9/1982, de 10 de agosto, de Estatuto de Autonomía de Castilla-La Mancha" (PDF). Boletín Oficial del Estado (in Spanish). Retrieved 11 July 2024.
- BOE (1985). "Ley 7/1985, de 2 de abril, Reguladora de las Bases del Régimen Local" (PDF). Boletín Oficial del Estado (in Spanish). Retrieved 11 July 2024.
- BOE (1986). "Real Decreto Legislativo 781/1986, de 18 de abril, por el que se aprueba el texto refundido de las disposiciones legales vigentes en materia de Régimen Local" (PDF). Boletín Oficial del Estado (in Spanish). Retrieved 11 July 2024.